Portfolio Update: 25 Year Trading Experiment | August 2026
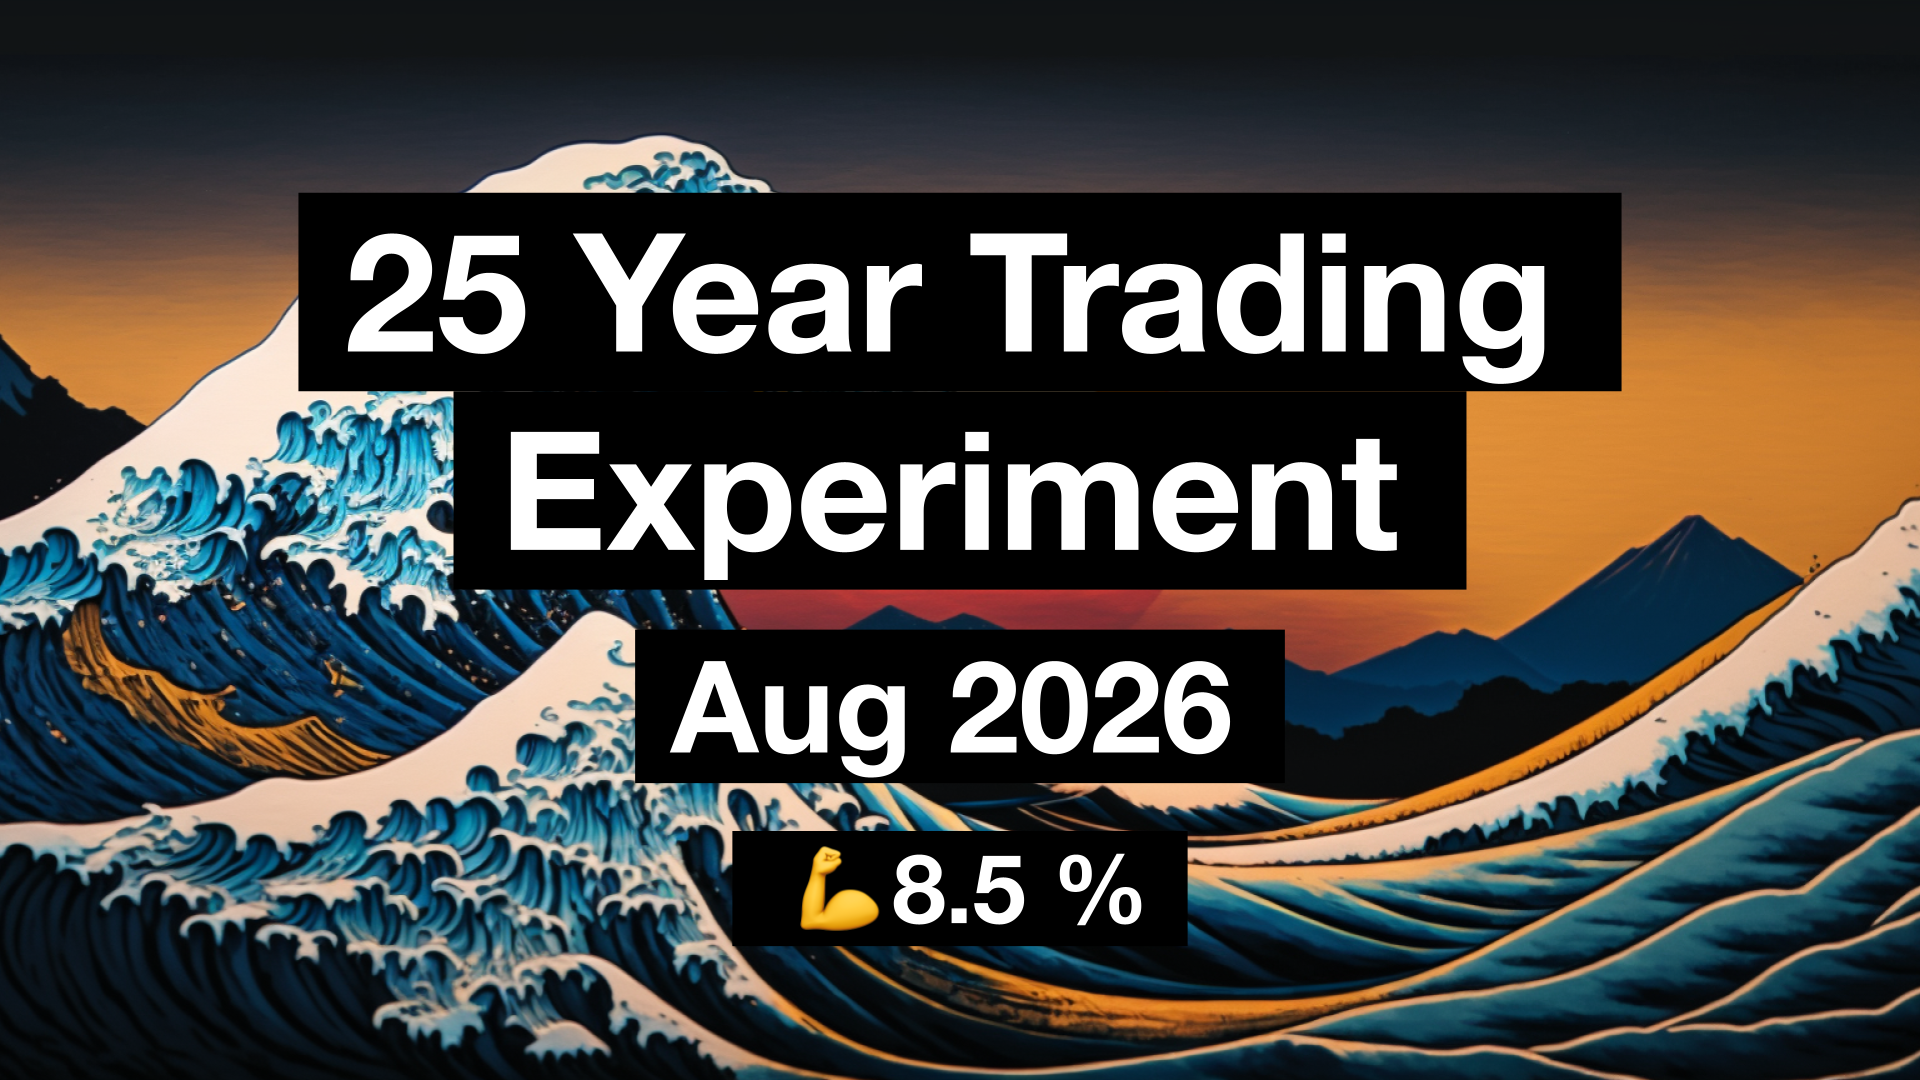
Month 18 complete. The active portfolio is up +34.3% from inception, the passive at +25.8%. Active outperformance stands at 8.5 percentage points. Total portfolio value is now 234,062 kr ($24,585).
This was a quiet month. The active side returned -0.1%, the passive +1.4%. But the big move this month was capital deployment. Last month the portfolio sat at 44.8% cash, waiting for the right setups. Those setups arrived. Three new positions were opened in $PDD, $JD, and $CMG, bringing cash down to 3.0%. The portfolio is now fully invested across seven positions.
All trades are always shared live on X.com/tradergu, and the public trading dashboard is updated with the latest trade details and up-to-date portfolio allocations.
Performance: Inception to Date
The total portfolio value is now worth $24,585 (234,062 kr). The active portfolio’s lead narrowed slightly from 11.1pp last month to 8.5pp, as the flat month on the active side let the passive close the gap a bit.
- Actively Traded Portfolio: +34.3%
- Passively Invested Portfolio: +25.8%
- Outperformance: +8.5pp
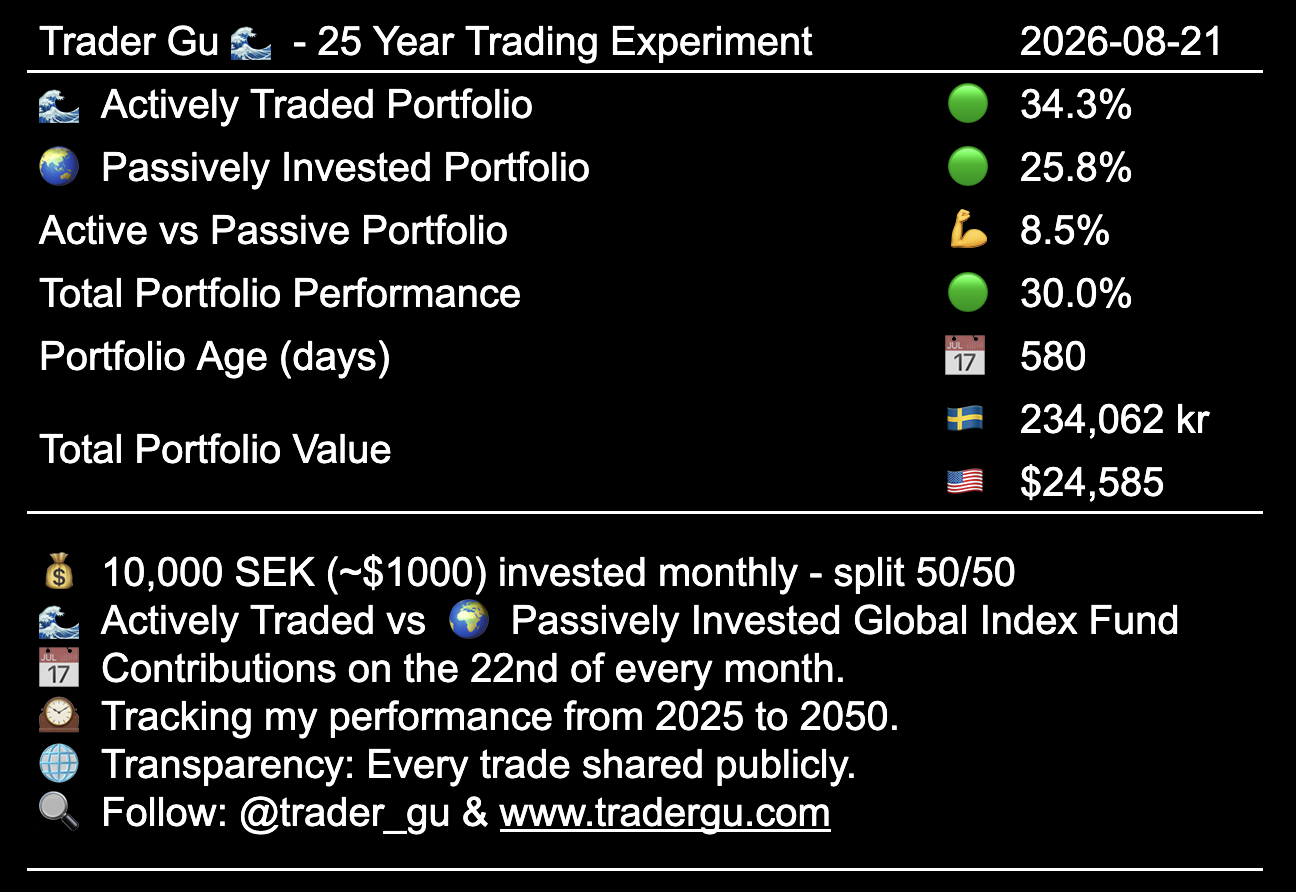 Performance: Inception to Date
The goal is to outperform the global index over a 25 year period through disciplined active Swing Trading.
Performance: Year to Date
2026 remains strong for both portfolios. The active portfolio is up +22.8% year-to-date, the passive +20.7%. The active lead has narrowed from 4.1pp last month to 2.1pp.
- Actively Traded Portfolio: +22.8%
- Passively Invested Portfolio: +20.7%
- Outperformance 2026: +2.1pp
 Performance: Year to Date
Performance: Month to Month Overview
Month 18 was flat for the active portfolio at -0.1%, while the passive gained +1.4%. After four consecutive months of strong performance on the active side, a consolidation month is expected.
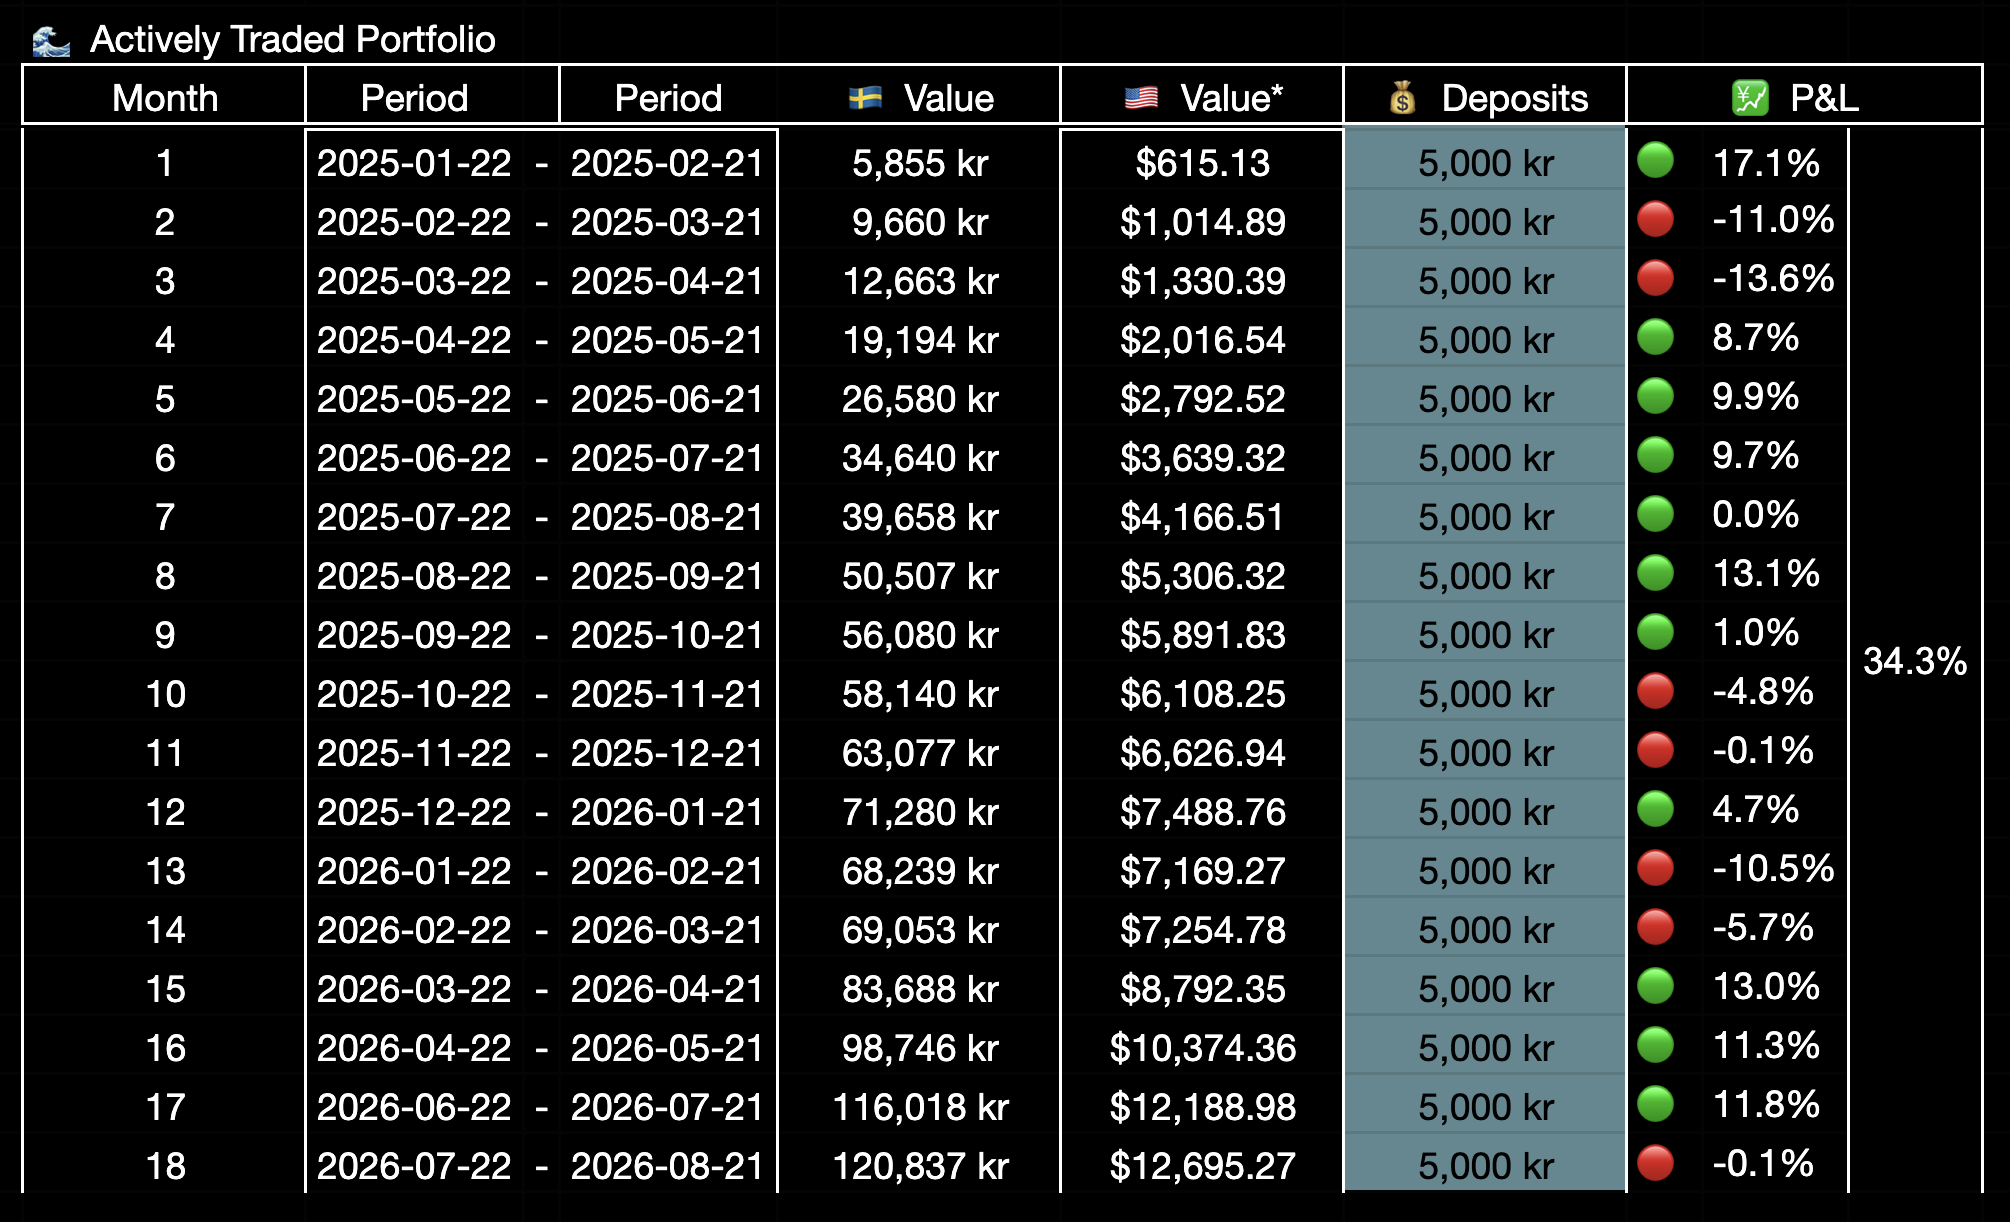 Performance: Month by Month, Actively Traded Portfolio
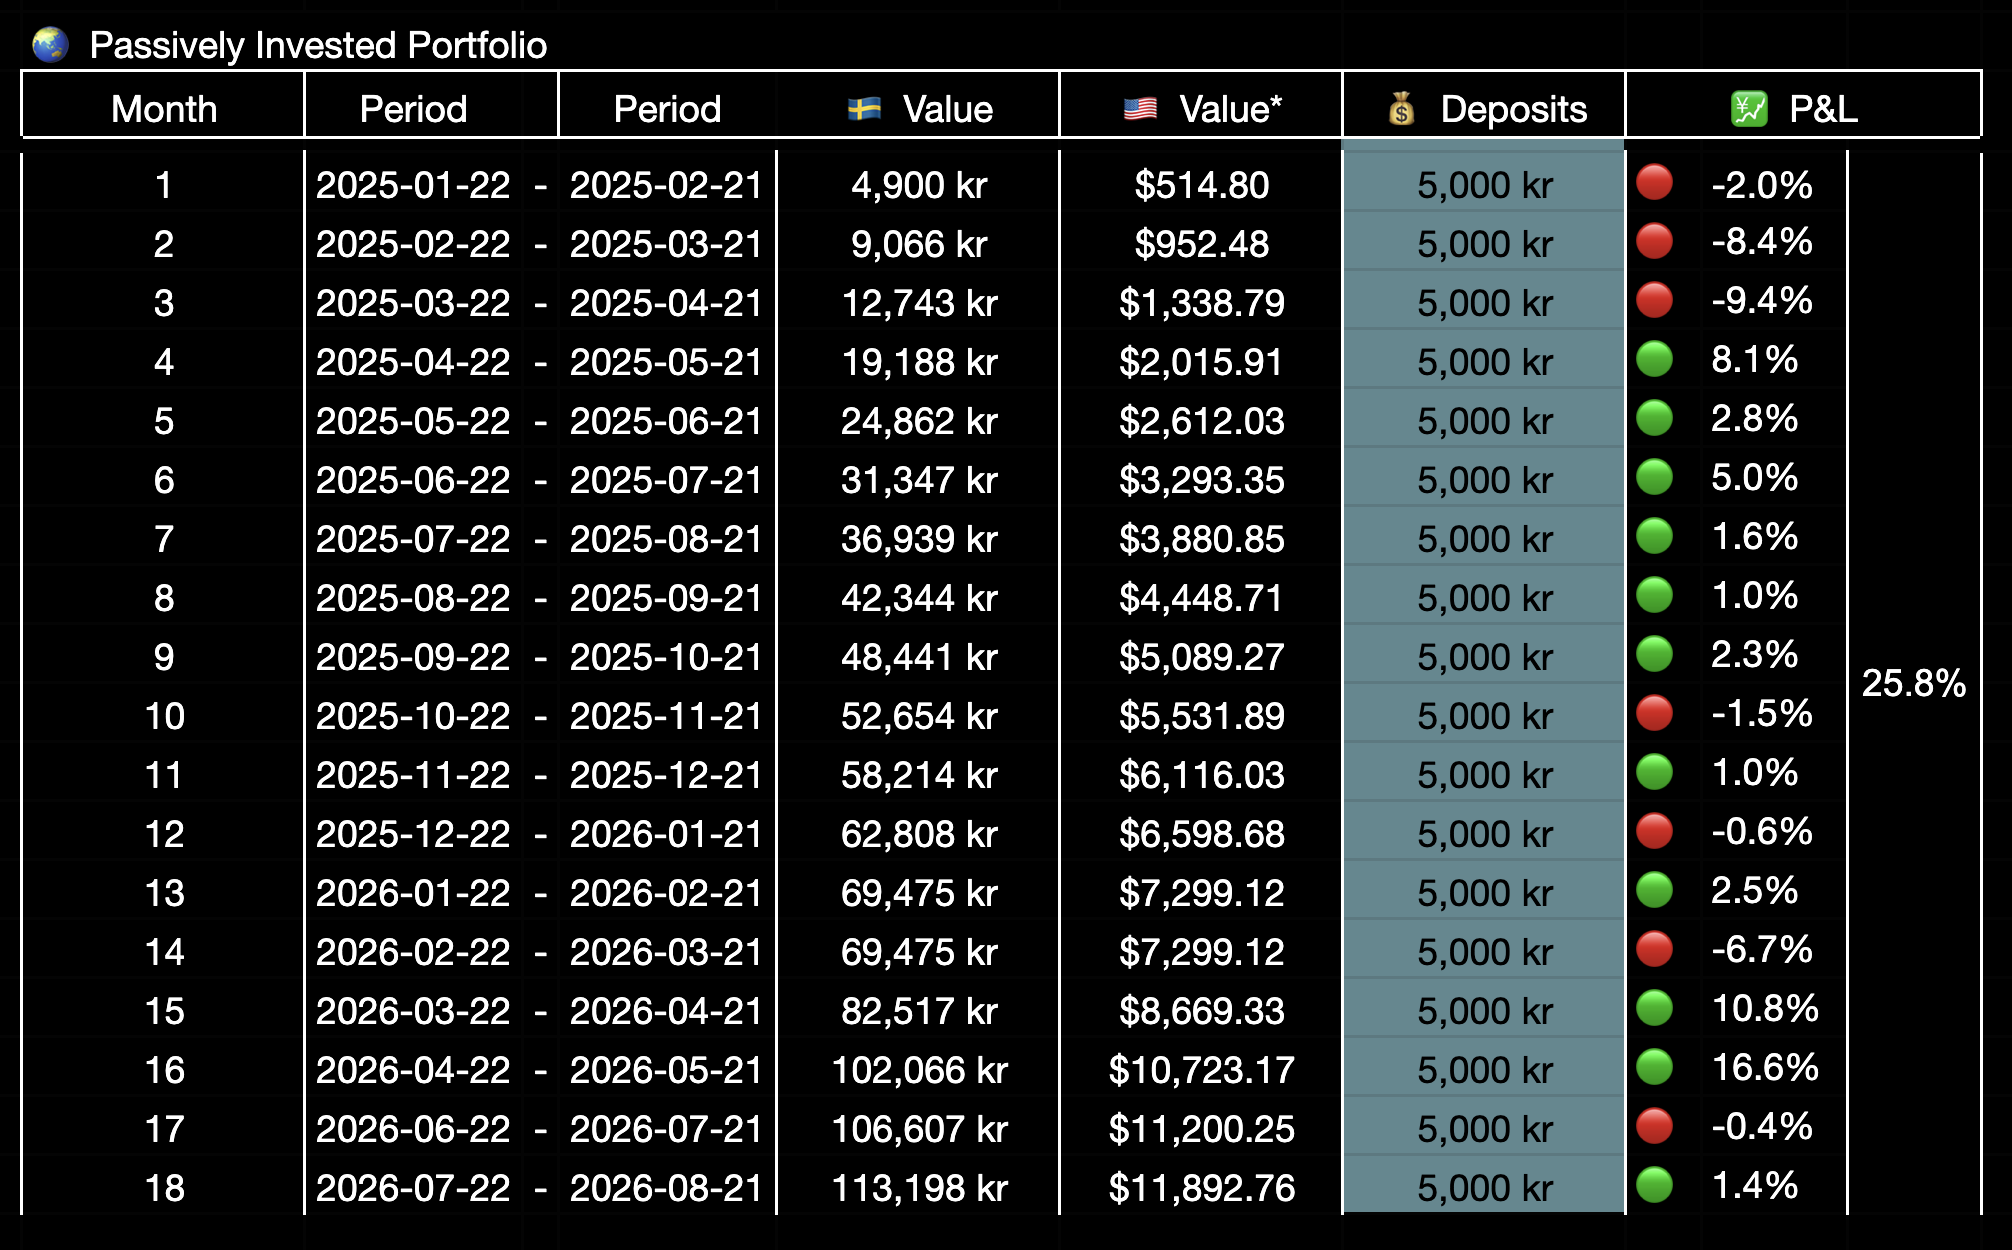 Performance: Month by Month, Passively Invested Portfolio
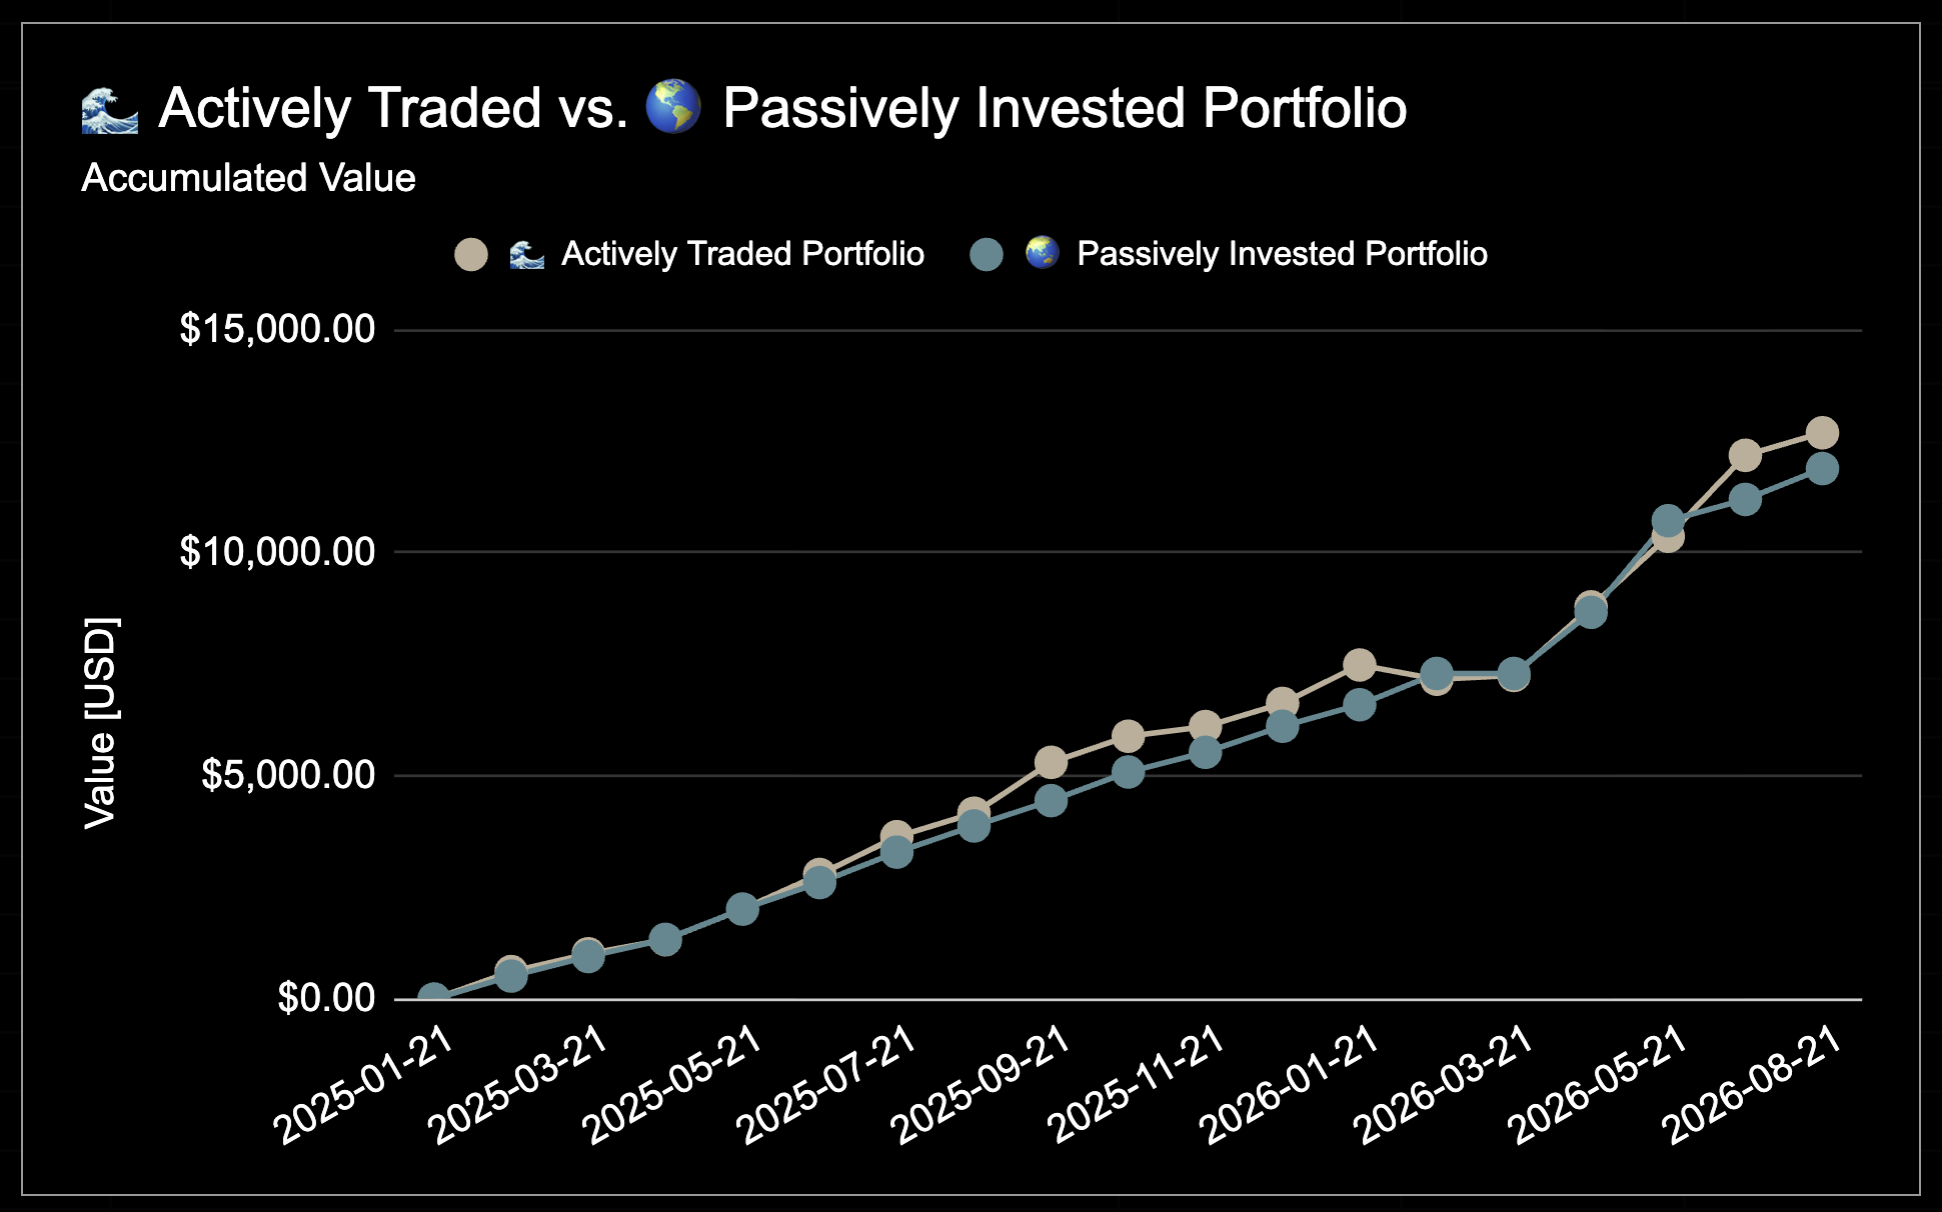 Performance: Month by Month, Chart
Open Positions
The portfolio underwent significant capital deployment this month. Last month’s 44.8% cash position has been reduced to 3.0%. Three new positions were opened: $PDD, $JD, and $CMG. $BRKR was closed. The portfolio now holds seven positions: $LULU (19.1%), $JD (18.5%), $CMG (17.4%), $NVO (14.7%), $PDD (13.9%), $BABA (10.3%), and $NOVO-B (3.0%).
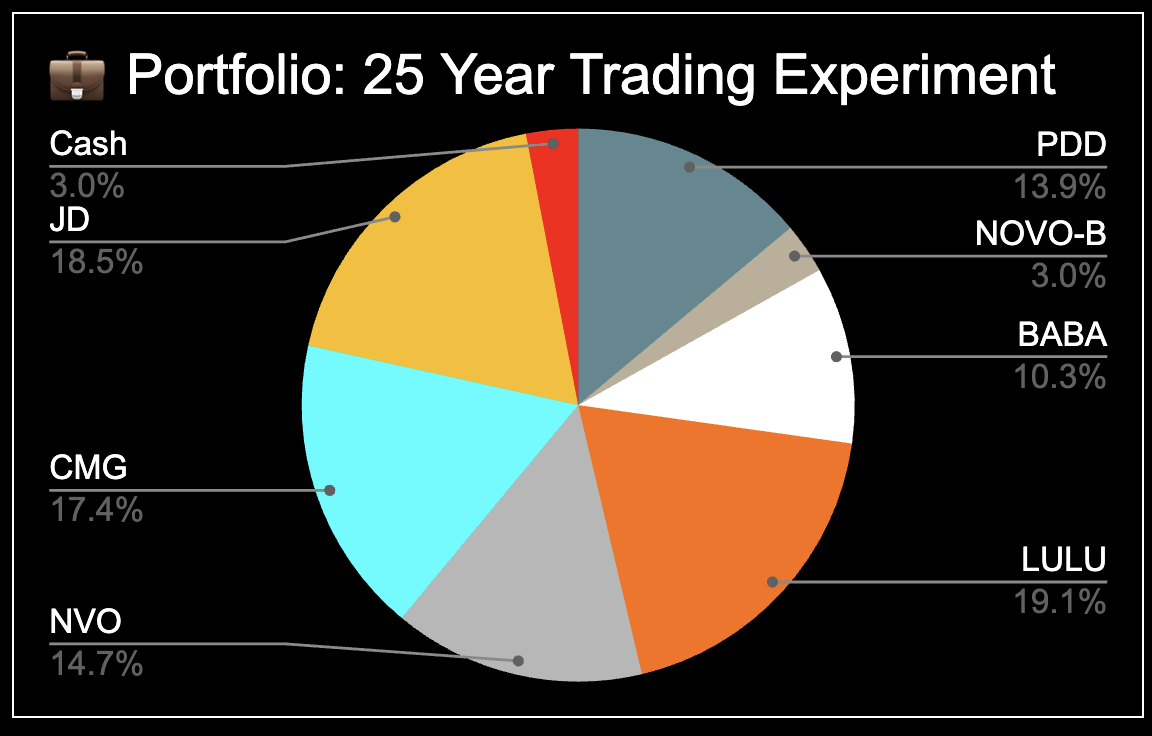 Open Positions
Risk is spread across the portfolio. $PDD and $NVO carry the highest individual risk at approximately 5.5% and 5.3% of the portfolio respectively.
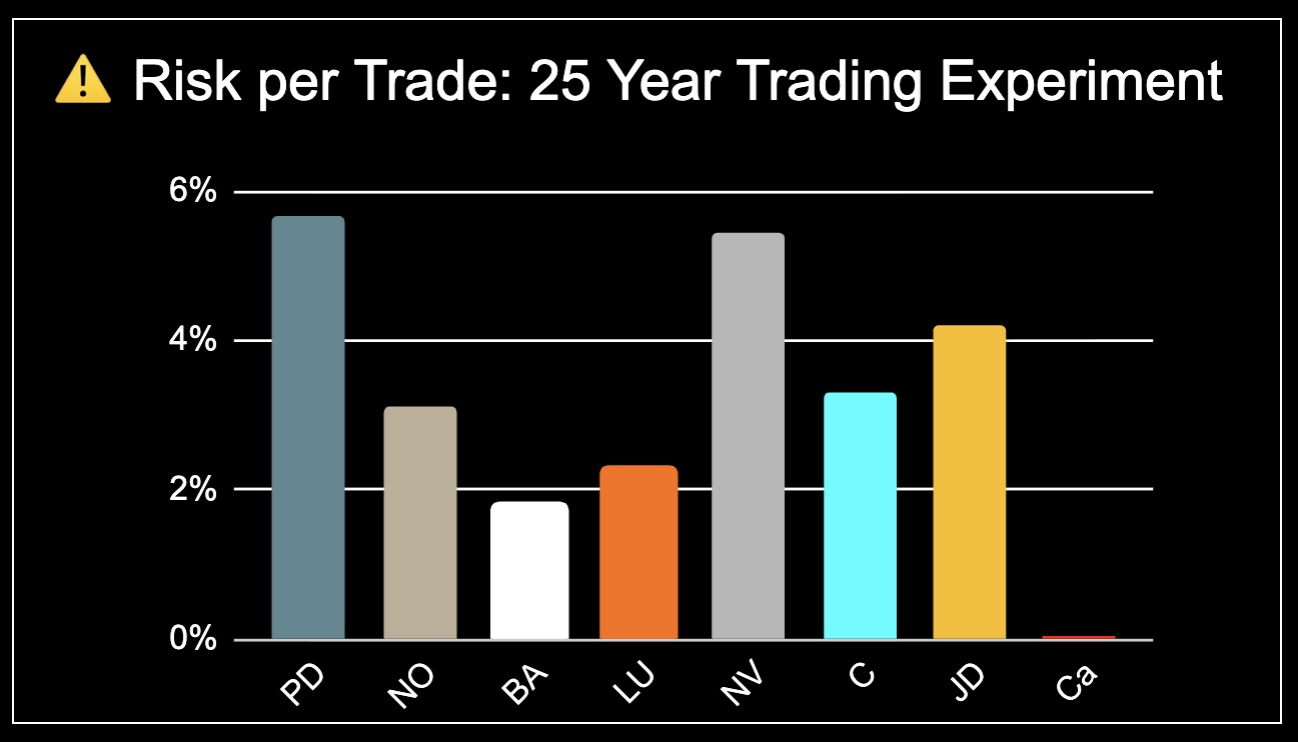 Risk per Trade
Open Positions: Detailed Overview
The following table contains the entry, stop loss, position size, and current market prices.
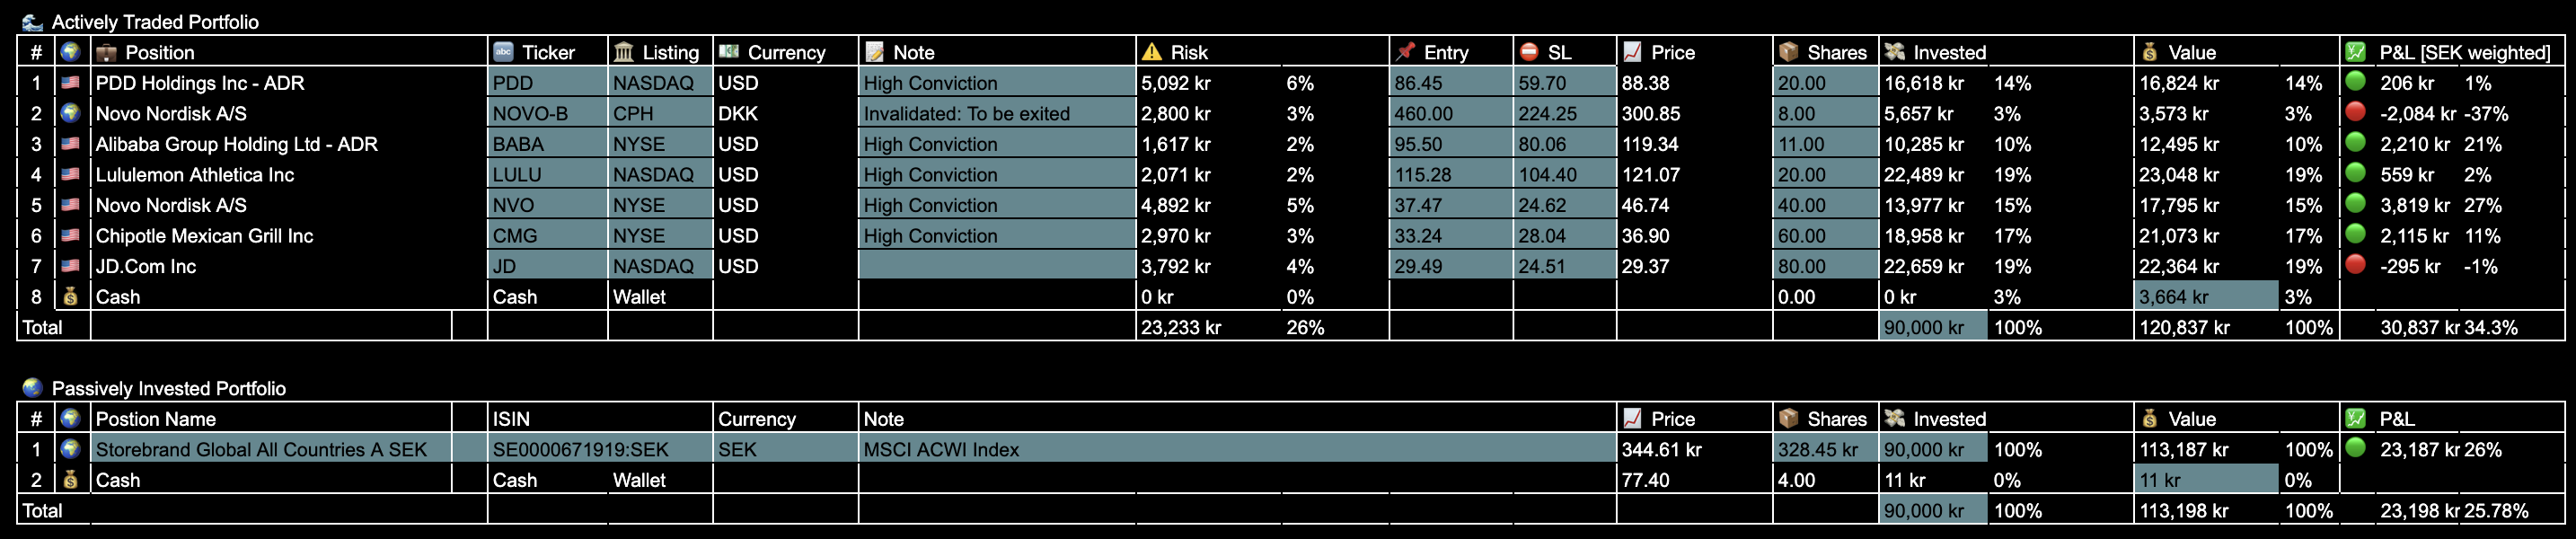 Open Trades: Details
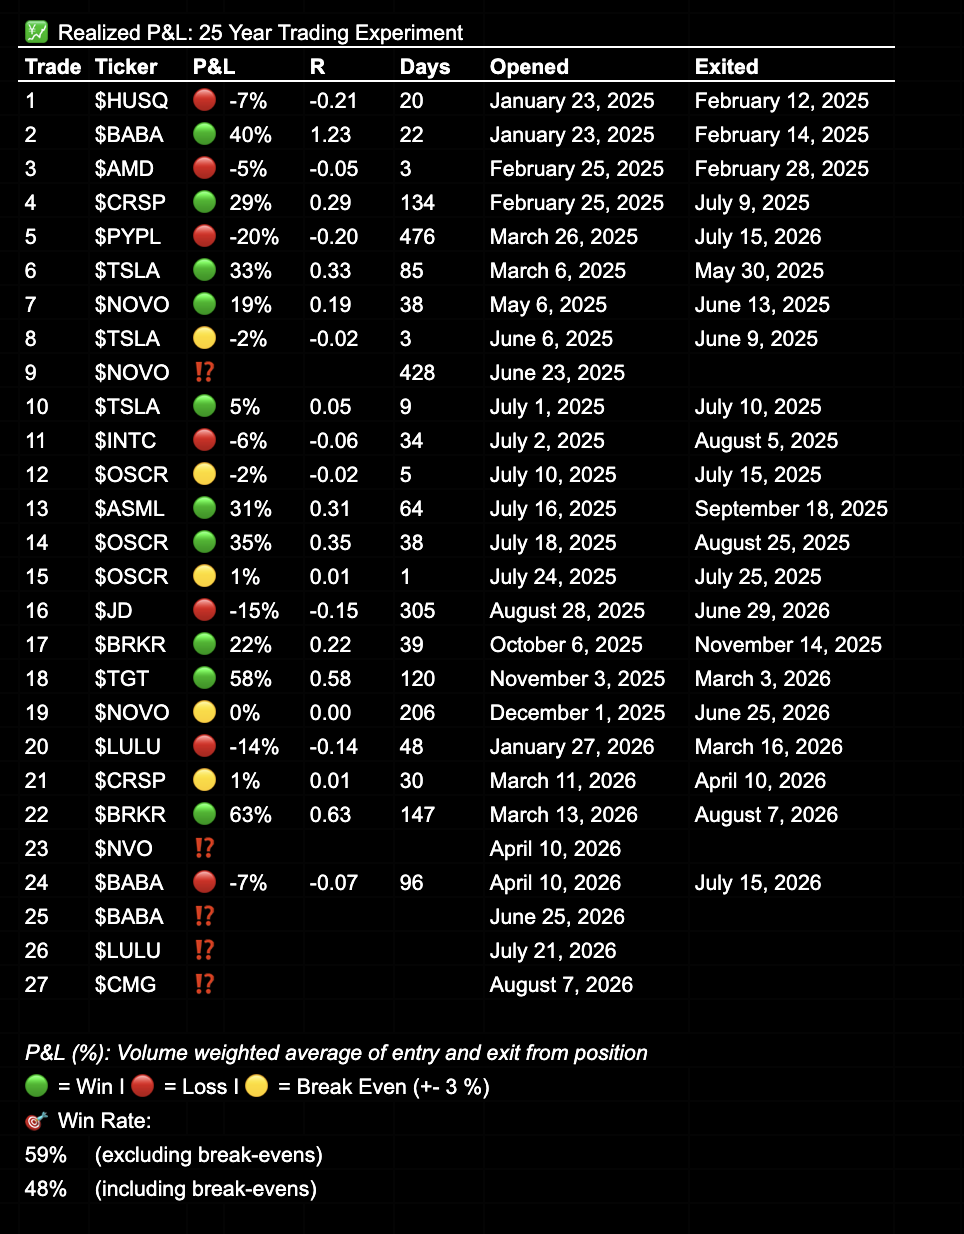
Realized P&L & Win Rate
Win rate: 59% excluding break-even trades, 49% including them.
 Realized P&L
25 Year Trading Experiment
For a full overview of the experiment’s purpose and structure, check out my 25 Year overview page, or watch the previously released YouTube introduction.
In short:
- 10,000 SEK (~$1,000) invested monthly - split 50/50
- Actively Traded vs Passively Invested Global Index Fund
- Contributions on the 22nd of every month
- Tracking my performance from 2025 to 2050
- Transparency: Every trade shared publicly
Summary
Last month I said the 44.8% cash position was intentional. This month I deployed it. Three new positions were opened and the portfolio is now fully invested across seven names, diversified across sectors and geographies.
The active portfolio gave back a small amount of its lead this month, narrowing from 11.1pp to 8.5pp. That is fine. Not every month needs to extend the gap. The positions are in place and the process continues.
The portfolio is now 580 days old. That is about 6.3% of the 25-year journey.
How are your portfolios performing?
Share your thoughts on X or subscribe to the newsletter for monthly updates.
High Conviction Swing Trading
Learn the full strategy
A structured swing trading course. Market structure, order blocks, position sizing, and trading psychology.
Start learning →